The number that was meant to tell you whether you are improving
Building a single index that works for a beginner and for a professional is harder than it looks. Mine broke twice on a real user, and in the end the right answer was to remove it.
Why do we buy a trainer and an app to use it? For two reasons, I think: to improve, and to have fun while we do it. The second is decided by the road you choose. The first needs something that tells you whether it's working.
Not a badge, not a streak of consecutive days. A measurable number that goes up if you're getting better and down if you're getting worse. I tried to build it. This is the story of how it broke twice, and of how in the end the right answer was to remove it.
The first version
On 19 August the number existed: a score from 1 to 10, built on Coggan's power profile table. For four durations (5 seconds, 1 minute, 5 minutes and threshold), the table says how many watts per kilo correspond to each level, from beginner to professional. The score placed each of your four durations on the table and took a weighted average: 40% threshold, 25% five minutes, 20% one minute, 15% sprint. Those weights were our choice, not Coggan's.
It seemed reasonable. It lasted three days.
The first break: who decides whether an effort counts?
A score built on your best five seconds has an obvious problem: if you never sprinted during a ride, your best five seconds aren't your sprint. They're just the five seconds in which you pushed a bit harder. Putting them in the score would make you look weaker than you are.
So I needed a criterion to decide whether an effort had really been attempted. What I had written required each duration to have a fixed ratio to threshold: for example, the five seconds counted only if they were at least 1.8 times FTP.
On 22 August I ran the test on a real bike and trainer, and the result was this: I had done the five-second sprint and the one-minute one, and the score doesn't include them. The criterion was unreachable precisely for anyone with a high threshold relative to their power over short durations. The more of a diesel you were, the less your sprint counted.
Instead of reasoning about it, I simulated
The temptation was to fix the ratio: lower 1.8 to 1.5 and try again. But that would have been guessing another number. The real question was a different one: is there a ratio between two durations that tells a maximal effort from one that isn't?
To answer I built 768 synthetic athletes with the three-parameter critical power model, which describes how much power a person can hold and for how long. Sixteen critical power values, from 100 to 475 watts. Twelve anaerobic reserves, from 8 to 30 kilojoules. Four peak powers, from 2.5 to 4 times critical power. Sixteen times twelve times four: 768 different profiles, from beginner to sprinter. For each, maximal efforts and non-maximal efforts, and the question: does the ratio separate them?
It didn't. On the ratio between five seconds and one minute, maximal efforts averaged 1.144 and non-maximal ones 1.068: a 7% difference, within the noise. On the ratio between one minute and five minutes it was worse: 1.173 against 1.251. The order was inverted.
No ratio between durations can tell whether an effort was maximal. It wasn't a badly chosen threshold: it was the wrong question. Even the first rewrite, which compared each duration with the next one on the same curve, failed the same test.
So I stopped guessing. Today it's the workout that declares it: a structured test knows which steps ask for a maximal effort, the ride records it, and the profile reads what was declared instead of what it should have deduced.

The second break: the beginner
The next day another problem came up. Below 2.22 watts per kilo the score was exactly 1.00. A rider at 1.5 W/kg, one at 2.0 and one at 2.22 all read the same number.
Coggan's table starts from a level that someone who has just begun hasn't reached yet, and everything below it ended up squashed onto the first step. The very person who improves fastest, the beginner, saw a number that never moved. The fix was simple: below the first row the scale goes down to zero, instead of stopping.
The rule I had set myself
There was also a rule I had set myself, which, rereading it now, becomes full of meaning: if we get worse in our workouts, the number must go down too.
All-time bests never go down: a record stays a record even if it's two years old. A number built on records can only go up, and so it says nothing about how you are now. The score started reading only the last ninety days.
Why I finally removed it
With the criterion fixed, the floor fixed, and the ninety-day window added, the score worked. And on 26 August I removed it anyway.
The reason is arithmetic. A weighted average moves less than each of its columns. If your sprint improves by a whole level, the score shifts by 0.15: less than anyone would notice looking at it. I had built a number to say you are improving, and when you improved it didn't move.
In its place there are now the things the score summarised, each on its own:
- the watts at each duration, with their movement over the last ninety days, for example +14 W in 90 days;
- threshold, with how many watts are missing to the next band, because a name ranks and a distance is a goal;
- and the Coggan table label, but small, stating which population it is calibrated on.
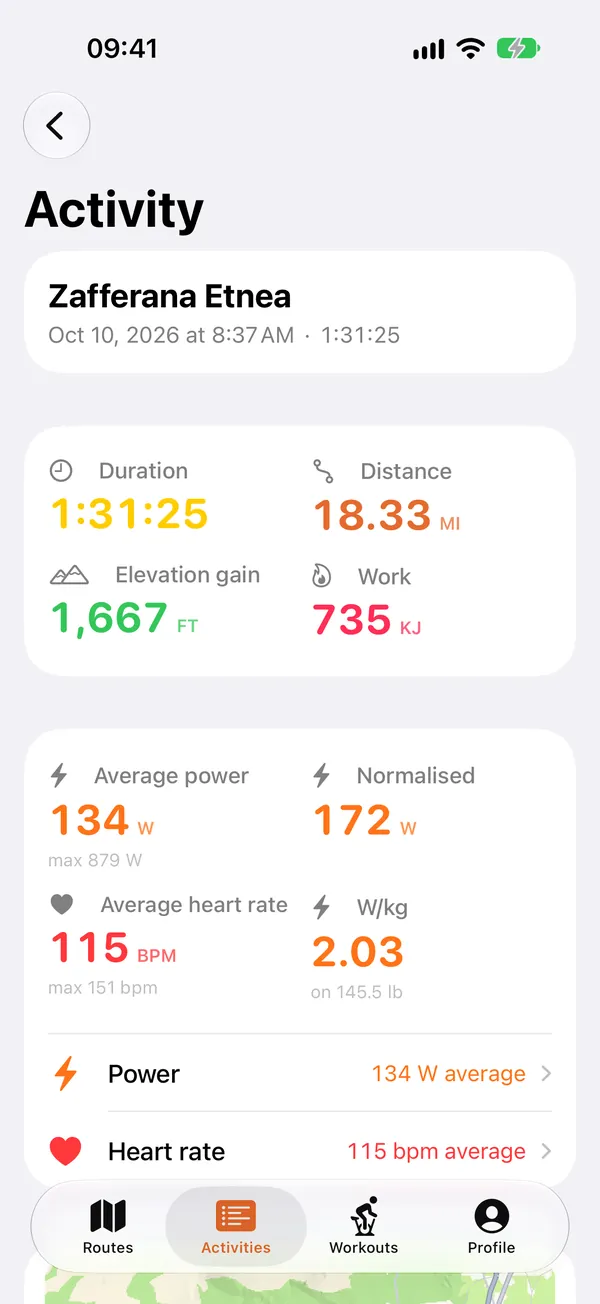
That last one is the final fix, from 31 August. My profile is 6.00 W/kg over five seconds, 4.28 over one minute, 2.91 over five minutes, 2.11 at threshold, and for Coggan's table this is “untrained”. It's true, compared with racers: the table is built on competitive cyclists, and its lowest row doesn't describe someone who trains to feel better. The calculation was right. It was the hierarchy of the screen that was wrong: the label was at the top, the watts at the bottom. And above all, it didn't take into account someone who had just bought the trainer in order to grow and improve.
What I take away
In a week the number was born, broke twice and vanished. The part that taught me the most was the check: 768 synthetic athletes answered a question I could have reasoned about for weeks, and they answered that the question was wrong.
An index that can't go down isn't a measurement: it's a decoration. And an index that moves less than what it measures isn't even that. What was needed wasn't a better number. It was the watts, and the direction they are heading in.
Grade is a GPX route simulator for smart trainers. You import the track of a real ride, and the trainer gives you its climbs, gradient by gradient, metre by metre. iPhone, iPad, Mac.